- >>Weather by month // weather averages Jenig
- >>Climate graph // Weather by Month Jenig
- >>average temperature by month Jenig
- >>Weather Jenig
The designated area is positioned within the northern hemisphere of our globe. The warm and pleasant days of the Summer season commence towards the conclusion of June and come to an end in September. This particular period includes a span of months, namely: June, July, August, September.
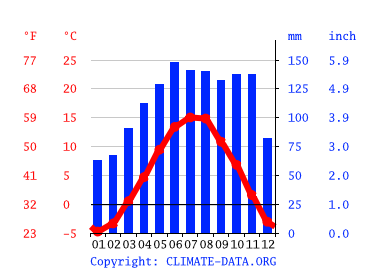
Climate graph // Weather by Month Jenig

Precipitation is the lowest in January, with an average of 63 mm | 2.5 inch. The maximum quantity of rainfall is observed during the month of June, exhibiting an average value of 148 mm | 5.8 inch.
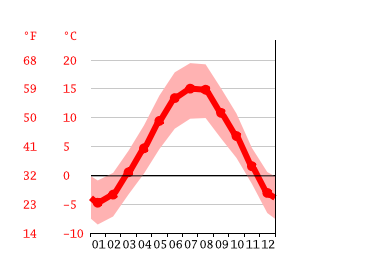
average temperature by month Jenig

At an average temperature of 15.0 °C | 59.1 °F, July is the hottest month of the year. During the month of January, there is a notable drop in temperature, with an average low of approximately -4.8 °C | 23.4 °F.
Weather by month // weather averages Jenig
| Avg. Temperature °C (°F) | Min. Temperature °C (°F) | Max. Temperature °C (°F) | Precipitation / Rainfall mm (in) | Humidity (%) | Rainy days (d) | avg. Sun hours (hours) | |
|---|---|---|---|---|---|---|---|
| January |
-4.8 (23.4) |
-8.5 (16.6) |
-0.9 (30.4) |
63 (2.5) |
76% | 8 | 5.0 |
| February |
-3.3 (26) |
-7.1 (19.1) |
0.4 (32.8) |
67 (2.6) |
74% | 8 | 5.0 |
| March |
0.5 (33) |
-3.3 (26) |
4.3 (39.7) |
91 (3.6) |
75% | 9 | 6.0 |
| April |
4.7 (40.4) |
0.3 (32.5) |
8.7 (47.6) |
112 (4.4) |
74% | 11 | 7.0 |
| May |
9.4 (49) |
4.5 (40.2) |
13.8 (56.9) |
129 (5.1) |
76% | 14 | 8.0 |
| June |
13.4 (56.1) |
8.1 (46.6) |
17.9 (64.2) |
148 (5.8) |
75% | 14 | 10.0 |
| July |
15 (59.1) |
9.8 (49.7) |
19.5 (67) |
141 (5.6) |
74% | 13 | 10.0 |
| August |
14.8 (58.7) |
9.9 (49.9) |
19.2 (66.6) |
140 (5.5) |
76% | 12 | 8.0 |
| September |
10.8 (51.5) |
6.4 (43.5) |
15.1 (59.2) |
132 (5.2) |
78% | 9 | 6.0 |
| October |
6.8 (44.3) |
3 (37.4) |
10.7 (51.3) |
137 (5.4) |
82% | 9 | 5.0 |
| November |
1.6 (34.8) |
-1.5 (29.4) |
4.8 (40.6) |
137 (5.4) |
82% | 9 | 4.0 |
| December |
-3.1 (26.5) |
-6.5 (20.2) |
0.6 (33) |
82 (3.2) |
76% | 8 | 5.0 |
| January | February | March | April | May | June | July | August | September | October | November | December | |
|---|---|---|---|---|---|---|---|---|---|---|---|---|
| Avg. Temperature °C (°F) |
-4.8 °C (23.4) °F |
-3.3 °C (26) °F |
0.5 °C (33) °F |
4.7 °C (40.4) °F |
9.4 °C (49) °F |
13.4 °C (56.1) °F |
15 °C (59.1) °F |
14.8 °C (58.7) °F |
10.8 °C (51.5) °F |
6.8 °C (44.3) °F |
1.6 °C (34.8) °F |
-3.1 °C (26.5) °F |
| Min. Temperature °C (°F) |
-8.5 °C (16.6) °F |
-7.1 °C (19.1) °F |
-3.3 °C (26) °F |
0.3 °C (32.5) °F |
4.5 °C (40.2) °F |
8.1 °C (46.6) °F |
9.8 °C (49.7) °F |
9.9 °C (49.9) °F |
6.4 °C (43.5) °F |
3 °C (37.4) °F |
-1.5 °C (29.4) °F |
-6.5 °C (20.2) °F |
| Max. Temperature °C (°F) |
-0.9 °C (30.4) °F |
0.4 °C (32.8) °F |
4.3 °C (39.7) °F |
8.7 °C (47.6) °F |
13.8 °C (56.9) °F |
17.9 °C (64.2) °F |
19.5 °C (67) °F |
19.2 °C (66.6) °F |
15.1 °C (59.2) °F |
10.7 °C (51.3) °F |
4.8 °C (40.6) °F |
0.6 °C (33) °F |
| Precipitation / Rainfall mm (in) |
63 (2) |
67 (2) |
91 (3) |
112 (4) |
129 (5) |
148 (5) |
141 (5) |
140 (5) |
132 (5) |
137 (5) |
137 (5) |
82 (3) |
| Humidity(%) | 76% | 74% | 75% | 74% | 76% | 75% | 74% | 76% | 78% | 82% | 82% | 76% |
| Rainy days (d) | 7 | 7 | 9 | 11 | 13 | 13 | 13 | 12 | 9 | 9 | 9 | 8 |
| avg. Sun hours (hours) | 5.1 | 5.3 | 6.1 | 7.0 | 8.1 | 9.8 | 9.9 | 8.5 | 6.3 | 4.8 | 4.1 | 4.7 |
Data: 1991 - 2021 Min. Temperature °C (°F), Max. Temperature °C (°F), Precipitation / Rainfall mm (in), Humidity, Rainy days. Data: 1999 - 2019: avg. Sun hours
Between the driest and wettest months, the difference in precipitation is 85 mm | 3 inch. The degree of fluctuation in the yearly temperature is approximately 19.8 °C | 35.6 °F.
In terms of relative humidity, the month that exhibits the highest level is November with a percentage of 74.31. Conversely, April has been recorded as having the lowest amount of relative humidity at only 74.31. It is noteworthy that June has the highest number of rainy days, amounting to 17.93, whereas the month with the least rainfall is January, experiencing only 9.67 wet days.
Jenig weather and climate for every month
Hours of sunshine in Jenig
- avg. hours of sun
- Total hours of sun


On average, the location of Jenig records the highest number of daily sunshine hours during July. The mean duration of sunlight per day in this month is approximately 9.9, with a total cumulative count reaching up to 306.84.
On average, Jenig records the lowest daily sunshine hours in January. During this period, there is an average of 4.06 hours of sunlight per day and a total accumulation of 121.76 hours.
Throughout the year, a total of 2427.96 hours of light are recorded in the location of Jenig. The monthly average for sunlight is approximately 79.71 hours.
Airport close to Jenig
The closest Airports of Jenig are: Klagenfurt Airport (KLU) 81.83km,Salzburg Airport (SZG) 130.76km,Innsbruck Airport (INN) 160.40km
You can reach Jenig from this Cities by Plane: London (STN), Vienna (VIE), Hamburg (HAM), Cologne (CGN), Linz (LNZ), Hurghada (HRG), Santa Cruz de Tenerife (TFS), Las Palmas de Gran Canaria (LPA), Heraklion (HER), Eindhoven (EIN), Zurich (ZRH), Berlin (SXF), Düsseldorf (DUS), Amsterdam (AMS), Palma de Mallorca (PMI), Antalya (AYT), Puerto del Rosario (FUE), Istanbul (IST)
