Tephra From the 3 March 2015 Sustained Column Related to Explosive Lava Fountain Activity at Volcán Villarrica (Chile)
 Jorge E. Romero1*
  Franco Vera2
  Margherita Polacci3
  Daniele Morgavi4
  Fabio Arzilli3
  Mohammad Ayaz Alam1
  Jorge E. Bustillos5 Alicia Guevara6 Jeffrey B. Johnson7 José L. Palma2 Mike Burton3 Evelyn Cuenca5 Werner Keller8
- 1Departamento de Geología, Facultad de Ingeniería, Universidad de Atacama, Copiapó, Chile
- 2Department of Earth Science, Faculty of Chemical Science, University of Concepción, Concepción, Chile
- 3School of Earth and Environmental Sciences, University of Manchester, Manchester, United Kingdom
- 4Department of Physics and Geology, University of Perugia, Perugia, Italy
- 5Escuela de Geología, Universidad Central de Ecuador, Quito, Ecuador
- 6Departamento de Metalurgia Extractiva, Escuela Politécnica Nacional, Quito, Ecuador
- 7Department of Geosciences, Boise State University, Boise, ID, United States
- 8Proyecto de Observación Volcán Villarrica (POVI), Fundación Volcanes de Chile, Santiago, Chile
Exceptionally intense lava fountains at open conduit volcanoes are infrequent, hazardous and little-warned events. Studying their tephra falls may reveal conduit dynamics, eruption source parameters and fragmentation mechanisms. Villarrica Volcano (Southern Andes of Chile) has sustained persistent open conduit activity, associated with a dynamic lava lake since at least 1984–85. Increased seismicity and degassing in August 2014 were followed by Strombolian activity starting in February 2015 and culminated with a 1.5 km-high lava fountain on 3 March 2015. This eruption produced tephra fallout, spatter agglutination, clastogenic lavas and mixed avalanche deposits. Here we characterized for first time Villarrica's 3 March 2015 tephra fall deposits produced by lava fountain and its rapid transition to sustained eruption column, providing valuable information on paroxysmal activity in open conduit volcanoes. Tephra was dispersed southeast of the crater in a narrow, elongated, nearly-elliptic area. Minimum observed tephra loading was estimated to be 80–120 g/m2 at crosswind locations, while maximum load estimation was about 11,500 g/m2, at 7–9 km distance from the vent. At 6–8 km downwind, the tephra fall deposit consisted of a single black scoria layer; fall varied from a lapilli blanket at medial distances (9–19 km) to a few individual particles at distal sites (20–43 km). All samples are vitrophyric and contain plagioclase (3–30%), clinopyroxene (2–5%), olivine (1–4%) and orthopyroxene (<1%) phenocrysts. We estimate that 1.4 × 10⁹ kg, equivalent to ~2.4 × 10⁶ m3 of basaltic andesite tephra (52.7–54.7 SiO2 wt. %), were erupted within a period of about 16 min at a mass eruption rate of ~1.5 × 10⁶ kg/s. The sustained eruption column height was estimated at ~10.8 km, with magnitude and intensity of 2.11 and 9.13 respectively. We propose that a rejuvenated, volatile-rich magmatic intrusion probably triggered paroxysmal activity. The Villarrica eruption is classified as a short-lived, large-scale lava fountain, similar to analogous historical events at Mt. Etna and Kilauea. As evident by devastating twentieth century Villarrica eruptions which also developed similar lava fountains, this eruption style should be considered as frequent and a potential source of volcanic hazard in the future.
Introduction
Lava fountains (also known as “fire fountains”) are powerful, continuous but normally short-lived gas jets (from less than one to a few hours) caused by fast-rising bubbly melt or the ascent of a bubble foam layer coming from depth (Parfitt, 2004). They typically emit lava fragments to heights extending tens to hundreds of meters (Bonaccorso et al., 2011). Most lava fountains reach 500–600 m above the crater (e.g., Houghton and Gonnermann, 2008; Taddeucci et al., 2015), but the highest reach ~2.0 km and are infrequent, violent and short-lived (e.g., Bonaccorso et al., 2014; Andronico et al., 2015). Their evolution is commonly initiated by Strombolian activity (resumption phase) followed by lava fountaining, and typically the formation of an eruption column (paroxysmal phase), which ends with the waning of the eruption (conclusive phase) (Andronico et al., 2015). As fountaining episodes are more frequent at open, passively degassing volcanic systems like that of Villarrica volcano, their onset can be sudden, sometimes with little to no advance warning or signals in monitoring data (Ruth et al., 2016). A population living close to an open-vent volcano may underestimate the scale of hazards, thus zonation should reflect potential hazards from both small and large eruptions, even if low-level activity appears dominant (Rose et al., 2013). Tephra fall from lava fountains threatens critical infrastructure and human activities around the volcano (e.g., Allard et al., 2005; Andronico et al., 2008, 2014a,b, 2015; Carracedo et al., 2012). A study of tephra fall deposits from lava fountains and paroxysmal phases, especially when they are exceptionally intense, is an essential tool for early assessment of conduit dynamics, hazards and impacts (e.g., Polacci et al., 2006; Gurioli et al., 2008; Andronico and Corsaro, 2011; Stovall et al., 2011; Corsaro and Miraglia, 2014; Ruth and Calder, 2014; Ruth et al., 2016) and provides critical information for better understanding of volcanic activity.
Villarrica Volcano (39°25′S, 71°57′ W; 2847 m high; Figure 1A) has been active since middle Pleistocene (Moreno and Clavero, 2006; Lohmar et al., 2012; Morgado et al., 2015), and is the most active stratovolcano of the Southern Andes Volcanic Zone (SVZ, Petit-Breuilh and Lobato, 1994; González-Ferrán, 1995). It has sourced about 100 small eruptions between AD 1384 and AD 1971 (Van Daele et al., 2014), among them at least 60 eruptions since AD 1558 (Petit-Breuilh and Lobato, 1994). The latest eruptions have been mostly effusive and slightly explosive, namely Hawaiian to Strombolian. Small lava fountains (heights up to ~30 m) are frequent at Villarrica and have been observed during periods of elevated activity, a result of vigorous seething magma involving a greater concentration of gas bubbles of likely larger size and higher velocity as they reach the surface of the lava lake (Calder et al., 2004; Palma et al., 2008). However, episodes with higher lava fountains (200–600 m) accompanied by successively taller eruption columns from 3 to 15 km above the vent, were observed during the eruptions of 1 and 31 January, 1948–1949, 2 March 1964 and 29 December 1971. Most of these eruptions triggered lava effusion, mixed (ice and pyroclast) avalanche generation and massive lahars, killing a total of 100 people and causing major disruption of human activities and damage to infrastructure (González-Ferrán, 1995; Naranjo and Moreno, 2004). Despite their significant impacts, including damage to agricultural fields and public and private infrastructure in Pucon (González-Ferrán, 1995), tephra deposits from these historical events have not been studied properly. The most recent explosive eruption occurred in 1984–85, when lava flows overtopped the summit crater rim. Since then, open-conduit dynamics associated with continuous shallow magmatic activity has been observed inside the crater at the summit of the volcano (Figure 1B), including continuous outgassing and “puffing,” roiling magma, small lava fountains, Strombolian explosions, gas jetting, and sloshing lava (Palma et al., 2008). Between August and December 1999, Villarrica showed a significant increase in seismic activity and lava lake activity increased as explosions occurred and destroyed the lava lake crust on at least 4 occasions (Calder et al., 2004). At least two instances of lava lake ascent in 2001 and 2004–05 are associated with increased volcanic activity, producing spatter explosions and small Strombolian eruptions affecting the crater perimeter (Calder et al., 2004; Palma et al., 2008). From 2005 to January 2015 most activity consisted of continuous outgassing, small Strombolian explosions, gas jetting and some small ash emissions due to sporadic collapse of material accumulated in the internal walls of the crater.
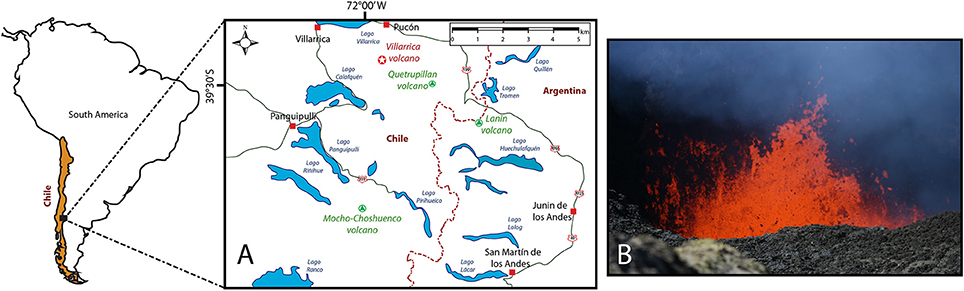
Figure 1. Villarrica volcano. (A) Location of Villarrica and main neighboring cities and towns (red squares). Main roads are in green lines, the international border is in pale-red segmented line and lakes are clear blue bodies. (B) Typical background magmatic activity inside the crater of Villarrica. Picture by Patricio Arias in 2010.
A new eruptive cycle with vigorous Strombolian activity began in February and preceded the highest historical lava fountain event of the volcano (1500 m high) on 3 March 2015. Activity started at ~03:08 h local time and terminated at about 03:26 h. This short-lived eruption produced heavy tephra fall to the east and clastogenic scoria flows, predominantly on the northern and eastern flanks of the volcano, due to spatter coalescence (Johnson and Palma, 2015). Although previous field observations have described the nature of pyroclastic products from this eruption (e.g., Bertin et al., 2015), detailed studies are required to better understand the eruptive parameters, triggering mechanisms and conduit dynamics Development of the 3 March 2015 lava fountain and the main features of the erupted tephra (distribution, mass, grain size, textural, and composition), together with eruption source parameters, have been investigated to determine their critical importance for tephra fall risk assessment. Tephra properties have been compared with texture and geochemical composition of samples collected from the crater rim of Villarrica erupted on 9 and 15 December 2015 and 13 February 2017.
Eruption Chronology
Since April 2012, the surface activity of Villarrica has exhibited deepening of the active lava lake which persisted at a depth of 120–130 m below the crater rim up to February 2015 (Romero et al., 2016a; Johnson et al., 2018). Unrest initiated in August 2014, when the number of long-period (LP) seismic events increased and higher SO2 fluxes (up to 5,000 tons/day) were recorded up until a few days before the eruption (Giacomozzi et al., 2015). On 12 December 2014, gas jetting (strong exhalations of gas) was caught on video operated by the Proyecto Volcan Villarrica (POVI) (http://www.povi.cl/2014.html). These signs of unrest were accompanied by a change in the gas emissions, from low CO2/SO2 ratios (0.65–2.7) during November 2014-January 2015 to CO2/SO2 ratios up to 9, while the H2O/CO2 ratio simultaneously declined (Aiuppa et al., 2017). During early February 2015, an abrupt increase in radiated infrasound power was observed coincident with increased vigor of Strombolian activity sourced from two small vents within the lava lake and material ejected beyond the summit crater (Johnson and Palma, 2015; Figure 2A). Ash venting and ballistics ejection, in addition to increase of seismic events and the real-time seismic amplitude measurement (RSAM), caused authorities to increase the volcanic alert level. A dramatic increase of LP seismicity >4,000 events between 1 and 16 February 2015, and a sustained increase in thermal anomalies (Inostroza et al., 2015) was coincident with an exponential increase in thermal radianceWm−2sr−1μm−1, as reported by near-real-time thermal monitoring of global hotspots (MODVOLC; http://modis.higp.hawaii.edu/) and Middle InfraRed Observation of Volcanic Activity Project (MIROVA; www.mirova.it). Ground deformation patterns were not observed through GPS network or interferograms prior to eruption (Córdova et al., 2015; Delgado et al., 2017).
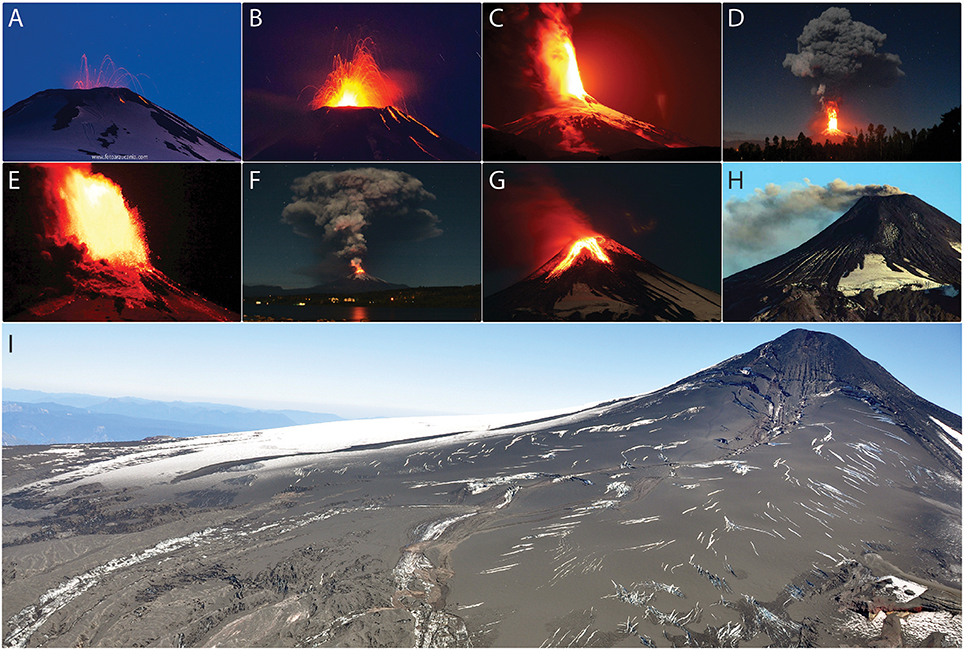
Figure 2. Chronology of the 3 March 2015 lava fountain episode. (A) Strombolian activity on 20 February 2015 (Diego Spatafore). (B) A rising of the lava lake level produced increased Strombolian activity on 3 March 2015 (Martini Fotografia). (C) Lava fountain activity since 03.08 local time on 3 March. (D) Paroxysmal tephra column at 03.20 local time (Nicolás Gallo). (E) Reduction of the lava fountain height at 03.22 local time. (F) Tephra column at 03.22 local time (José Rodríguez). (G) Clastogenic lavas seen after the end of the paroxysmal eruption. (H) Aspect of the mixed avalanche deposits and ash emissions on 18 March 2015. (I) Tephra fall deposit on the east-southeast flank of the volcano on 3 March (Daniel Basualto). Pictures (C,E,G,H) taken by Anselmo Durán.
Infrasound resonance observations suggest that the lava lake began to rise from about 70 m depth on 27 February to the flared upper part of the Villarrica crater, at depth ~50 m, before oscillating at that level between 1 and 3 March (Johnson et al., 2018). On 3 March, Strombolian activity initiated at 2:37 local time (UTC+3) with ballistics reaching >100 m height (Figure 2B). The maximum reduced displacement of seismic tremor increased from 30 to 400 cm2, and was followed by the beginning of a lava fountain phase at 3:08 local time consisting in a 1.5 km-high lava fountain (Figure 2C). Vigorous eruptive activity began at 03:10 and resulted in a 6–8 km-high sustained eruption column, which lasted for 16 min; the entire eruption lasted about 55 min (SERNAGEOMIN, 2015; Figures 2D–F). Thermal radiance reached a peak value of 81.8Wm−2sr−1μm−1 Wm−2sr−1μm−1. According to isochrons derived from GOES 13 satellite imagery, the eruptive plume drift speed was 8.57 m/s and the cloud had an estimated lowermost temperature of ~-40°C (http://satelite.cptec.inpe.br/).
Vera and Palma (2017) identified four clearly distinguishable types of volcanic deposits at a distance <3 km from the vent: (a) up to 5-m-thick agglutinated spatters, covering ca. 3 × 10⁵ m2 and radially distributed from the crater; (b) black, rugged clastogenic lavas formed due to spatter coalescence descending on the north flank (Figure 2G) and covering ca. 5 × 10⁴ m2; (c) a series of mixed-avalanche deposits which consisted of radially dispersed elongated deposits formed by a few centimeter-thick external crust of scoria and lithics with a central core of snow and ice up to a few meters (Figure 2H); and (d) a blanket of ash to lapilli sized scoria covering the east and southeast flank of the volcano (Figure 2I). Bertin et al. (2015) correlated the aerodynamic and breadcrust bombs to the spatter deposit, while describing low-density and high-vesicularity scoria as a typical product of the tephra fall deposit. Due to glacier melting (indicated by profuse water vapor production over the glacier in Figure 2E), a consequence of a-, b-, and d-type-deposits, lahars descended through Correntoso, Zanjón Seco-Carmelito, Pedregoso, and Turbio rivers draining the volcano(Flores and Amigo, 2015; Johnson and Palma, 2015).
Following the 3 March 2015 eruption there was a notable deficit in infrasound generation and the summit crater was temporarily plugged with a carapace of lava. Gradual collapse of the summit lava led to the resumption of typical open-vent activity by the end of March. Subsequent activities, until the end of April 2015, consisted of ash emissions and incandescence. About 1 month after the eruption, GPS stations detected an uplift (1 cm/month) ~2.5 km southeast of the vent, with an apparent source at a depth of 4.5–5.2 km, which could be well correlated with volcano-tectonic (VT) seismicity (Córdova et al., 2015). InSAR interferograms that span mid-April to mid-May 2015 showed a persistent uplift of 4–6 cm about 5 km southeast of the volcano with a modeled source located at a depth of ~4.2 km and a cumulative volume change of 7.5 × 10⁶ m3 (Delgado et al., 2017). This uplift was perhaps caused by refilling of the magma reservoir after the eruption or a pressurization of the magma chamber caused by degassing (Delgado et al., 2017). Until February 2017, vent activity was characterized by variations in the magma column level, minor Strombolian activity erupting scoria and spatter a few tens of meters above the crater level, and ash emissions associated with partial collapse of the crater walls.
Materials and Methods
Fieldwork
During the fieldwork in April 2017 and January 2018, mass per unit area (kg/m2) loads of tephra fall deposit were measured at 29 locations, together with the maximum particle size at 21 locations. Mass loadings were measured in-situ, but in order to rectify results for any existence of humidity in samples, random samples were selected and were measured again in laboratory and results show <1% wt. content in water. Thus, 1% mass was discounted for correction of tephra loads reported in Supplementary Table 1. Clast size measurements were made using three axis measurements and the average of the three largest particles per site (Supplementary Table 1). Mass loading measurements were made at flat sites with minimal effect of wind reworking or the influence of trees (shadow effect). Representative surfaces of 50 × 100, 50 × 50, and 25 × 25 cm2 were selected, depending on the amount of tephra found in a particular site. All sampled particles from the eruption were cleaned of foreign inorganic particle or organic matter, and dry weights were measured with a digital scale. The mass loading data were used for the construction of an isomass map of the fall deposits (Figure 3A), while satellite images were useful for the reconstruction of tephra dispersal patterns. On the basis of the proximity to the source and tephra load on the ground, the deposits were divided into proximal (6–8 km downwind; 12 data points), medial (9–19 km downwind; 11 data points) and distal (20–43 km downwind; 6 data points). No far distal (>43 km) data were collected during this study. An estimation of the total mass (TM) of the deposit was obtained by integrating tephra load over isomass area following both the Exponential Thinning (Pyle, 1989) and Weibull (Bonadonna and Costa, 2012) methods.
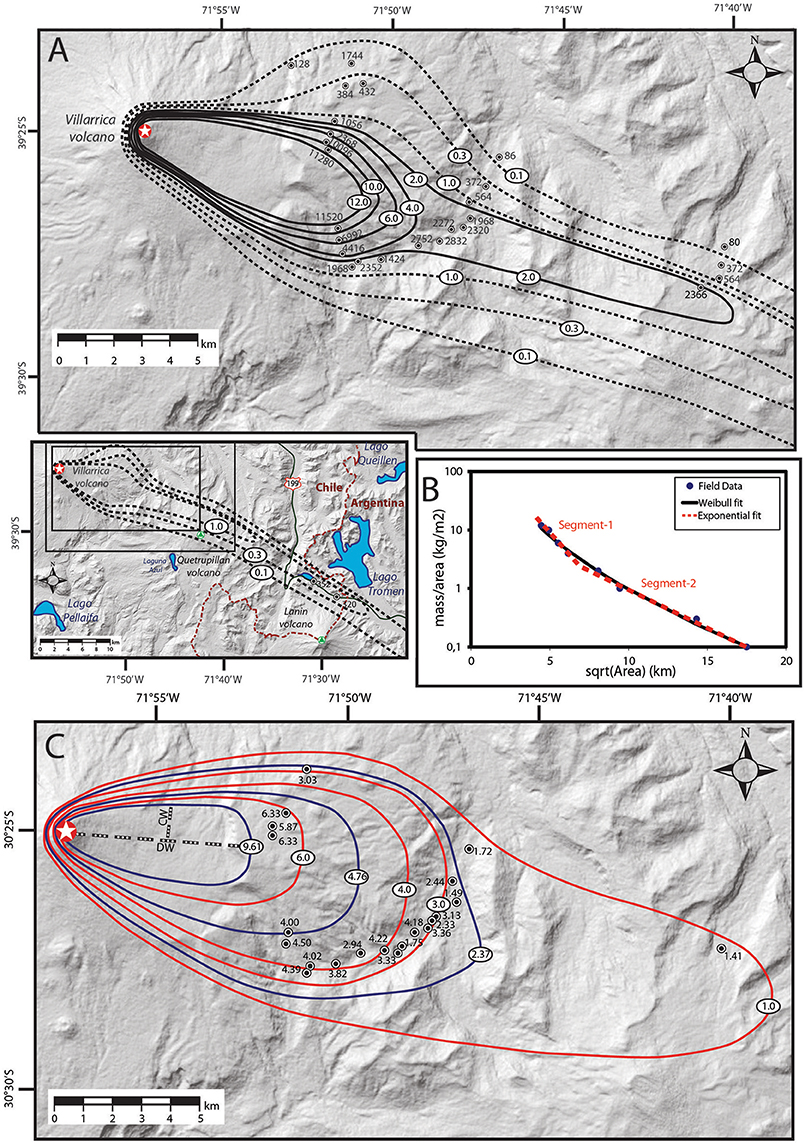
Figure 3. Distribution of the tephra fall deposit. (A) Isomass map. Load values on isopachs are expressed in kg/m2, while field data are released in g/m2 for detailed observation. Dotted lines represent isomass curves with uncertainty. (B) Load (kg/m2) v/s square root area (km) plot for the tephra fall deposit. Both Weibull and Exponential (two-segment) best fits are plotted. (C) Isopleth map. Clast diameters are in cm, and the red curves are based on field data. Blue curves are result from interpolation and were used for the calculation of column heights following the method of Carey and Sparks (1986). DW and CW represent example downwind and crosswind axes, as these were used for the earlier procedure.
Laboratory
Prior to characterization, tephra was dried at 35°C for 48 h. Grain-size analysis was carried out through dry manual sieving from 2,000 μm to 32 μm (−1 to 5 phi; fine lapilli to extremely fine ash) at steps of 1 phi (using seven meshes and one recipient for finer residuals). These size analyses allowed us to better describe magmatic fragmentation processes and to identify any potential contamination of tephra by ashes deposited subsequently. The relative density of juvenile particles was measured on 38 clasts and four sample types (7 from mixed avalanche deposit, 21 from scoria lapilli fallout, 3 from lava spatter and 7 from scoria bombs), using a distilled water pycnometer. Mean and standard deviation values were obtained from these samples. Representative samples from the four particle types were used for thin section preparation (thickness to 30 μm) and observation under polarizing microscope for petrographic and mineralogical description at the Department of Geology of the University of Atacama, Copiapó (Chile). Both particle density and petrographic description were used to investigate the textural variation (i.e., crystallinity and vesicularity) of different particles in order to assess conduit dynamics. A Tescan-Vega (Bruker) Scanning Electron Microscope with Energy Dispersive Spectroscope (SEM-EDS), operating at 15.0 kV and with a zoom of 20–250 x, was used for a qualitative description of juvenile textures at the Department of Extractive Metallurgy of the National Polytechnic School of Ecuador (DEMEX-EPN). Terminology from Parcheta et al. (2013) has been used on scoria vesicularity for descriptions, such as vesicle number density (VND) and vesicle size distribution (VSD). These observations informed an interpretation of quenching of pyroclastic fragments. The X-Ray intensities obtained through EDS semi-quantitative geochemical characterization directly on glass were converted to weight percent of oxides, which permitted constraints on nature of the magma feeding the 2015–2017 activity at Villarrica.
The 3 March 2015 tephra fall deposits
Distribution and Stratigraphy
Tephra dispersion mainly occurred southeast (~120° azimuth) of the crater in a narrow, elongated, nearby-elliptic area (Figure 3A). Minimum loads of about 80–120 g/m2, were observed at crosswind locations, where the mass of the deposit rapidly decreases to minimum values away from the downwind axis. In contrast, higher load values coincided with the dispersal axis and they diminished slowly from the source. Maximum loads of about 11,500 g/m2 were observed at a distance of 7–9 km from the source. A good correlation was observed in the plot of tephra load (kg/m2) vs. square root area (km) for both Weibull and Exponential fits (Figure 3B). On the other hand, the largest particles of the deposit were distributed in semi-elliptic isopleths trending southeast, decreasing rapidly from 6 cm to 1 cm diameter between 7 and 20 km away from the vent (Figure 3C).
At proximal locations, in the immediate vicinity of the crater (<1 km) the deposit stratigraphy consisted of non-welded agglutinated spatter bombs (Figure 4A) up to several meters in thickness (10–15 m), where meter-sized aerodynamic fusiform bombs were also found (Figure 4B). At proximal to medial locations, the tephra fall deposit consisted of a single black basaltic scoria layer, inversely graded and formed by medium-to-coarse lapilli and bombs (particle size > 4 mm) (Figures 4C,D), with a total thickness of 3–5 cm, corresponding to respective loads of 6 and 11 kg/m2. A progressive decrease in deposit thickness is observed from medial to distal deposits, where it varies from a 2 to 3 cm thick, medium- to coarse-lapilli blanket (particle size 4–32 mm; Figure 4E) to a single-particle medium-size lapilli blanket (4–8 mm; Figure 4F), where the thickness of the deposit was the same as the size of the smallest axis of these particles. Distal deposits were full of fine- to medium-size lapilli (Figure 4G), with ash at the bottom of the deposit. At farther distances (>40 km), only individual fine lapilli (2–5 mm) particles were found without the formation of a homogeneous tephra layer (Figure 4H). In those deposits, lapilli were partially cemented by the subsequent ash fallout from the eruption of Calbuco Volcano on 22–23 April 2015, which deposited a few mm of tephra in the area near to the international road (CH-199) and Mamuil-Malal mountain pass (see Romero et al., 2016b for details). Ash deposits were not detected at San Martín de Los Andes or Junin de los Andes in Argentina (Clarin, 2015).
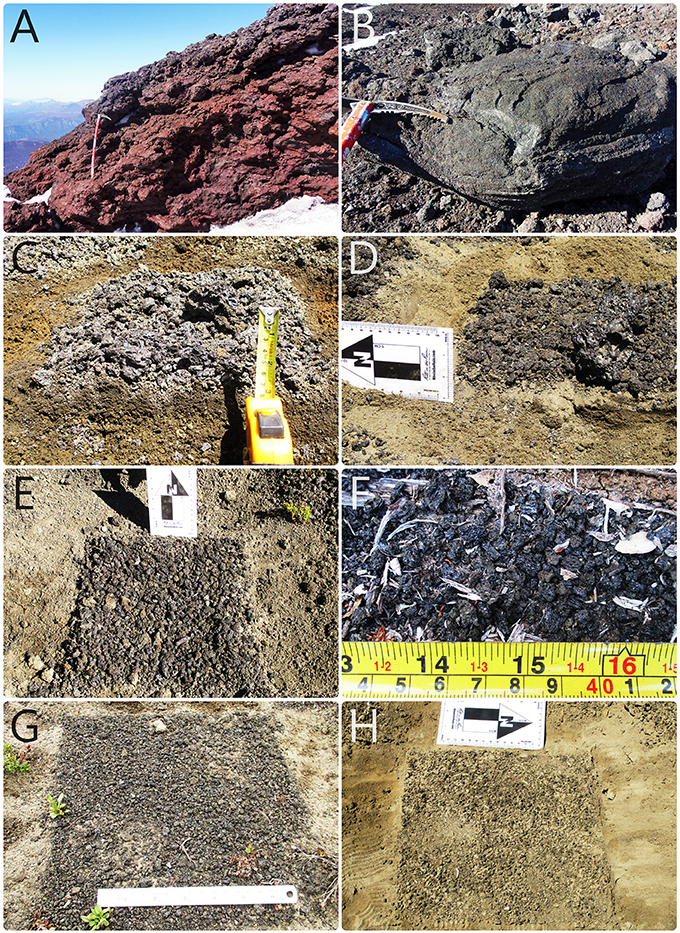
Figure 4. Field features of the tephra fall deposit. (A) Non-welded agglutination of spatters close to the summit of Villarrica (photo by Franco Vera). Ax pick is 66 cm long. (B) Metric-sized fusiform bomb in the upper flanks of the volcano (photo by Franco Vera). (C,D) Proximal, reverse graded tephra fall deposit at 6 and 7 km distance east-northeast from the vent, respectively. Decimetre-sized scoria bombs are found on top. (E) Medial deposit found 8 km southeast the vent. Note that the clast size is smaller (medium to coarse lapilli) than at proximal distances, and bombs are relatively scarce on top. (F) Medial deposit 13 km east-northeast from the vent, exclusively consisting of medium-sized scoria lapilli. (G,H) Distal deposits with fine to medium sized scoria lapilli at 21 and 43 km distance, east-southeast from the vent. Scale length in G is 16.5 cm. Pictures (B–H) by Jorge Romero and Franco Vera.
Characteristics of Tephra
All samples are compound by well sorted coarse ash to lapilli and they vary from unimodal (samples at sites 20 and 32) to bimodal (sites 14 and 36) in their grain size distribution. Frequent modes are at 750 μm (site 20), 1,500 μm (sites 14, 32, and 36), 187 μm (site 14), and 94 μm (site 36) (Figure 5A). The second mode of fine material at Mamuil-Malal (sample at site 36) has been correlated to ash from the Calbuco eruption, as confirmed by microscopic inspection of the sample.
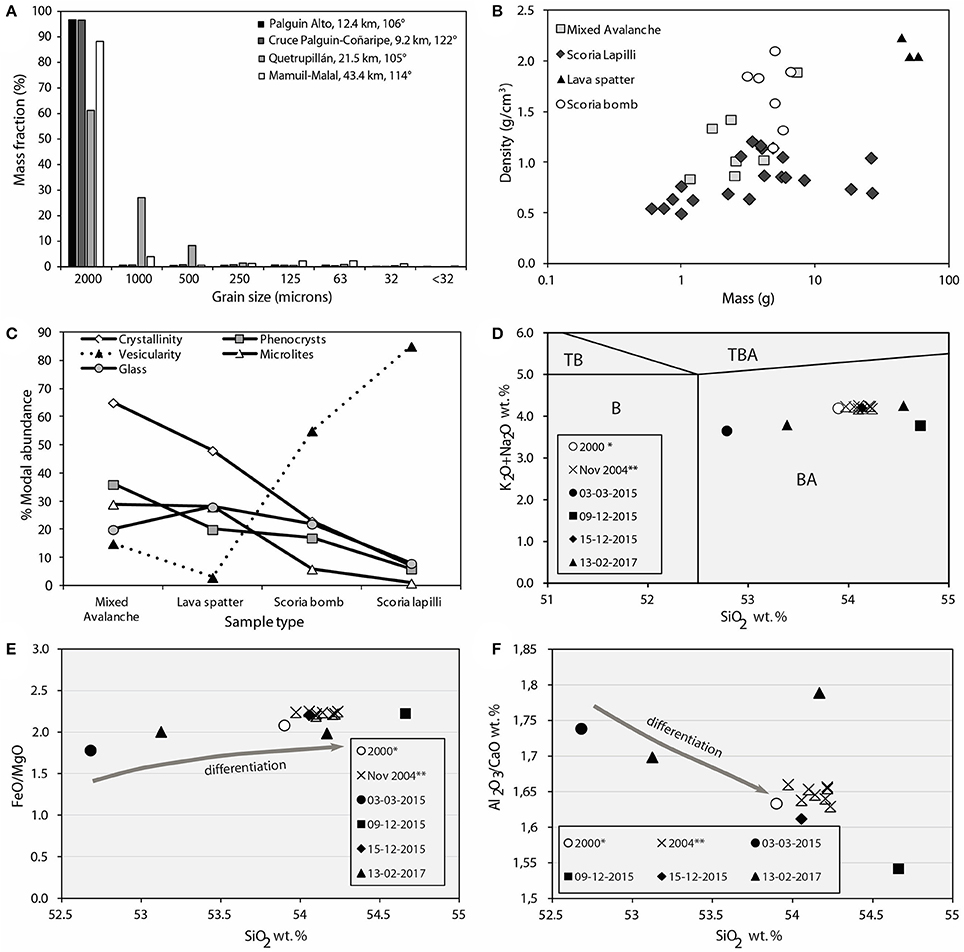
Figure 5. Characteristics of the 2015 tephra fall deposit. (A) Grain size features of selected tephra samples along the dispersal axis of the deposit. (B) Density of the different types of juvenile particles. (C) Total crystallinity and glass of samples. Note that phenocryst and microlite contents are both contained in total crystallinity. (D) SEM-EDS glass major element semi-quantitative geochemistry of four samples collected between 2015 and 2017. *Data from Witter et al. (2004) corresponds to glass composition of year 2,000 pumice fragment. **Data from Gurioli et al. (2008) corresponds to electron microprobe analyses of glass compositions. B, Basalt; BA, Basaltic andesite; TB, Trachybasalt; TBA, Basaltic trachyandesite. (E) FeO/MgO v/s SiO2 plot of the erupted material between 2015 and 2017. (F) Al2O3/CaO v/s SiO2 plot of the erupted material between 2015 and 2017.
Densest particles corresponded to spatter (2.10 ± 0.11 g/cm3), followed by scoria bombs (1.68 ± 0.34 g/cm3), and the mixed avalanche pyroclasts (1.20 ± 0.38 g/cm3); the lowest density samples corresponded to air fall lapilli (0.84 ± 0.23 g/cm3) (Figure 5B). All the samples are vitrophyric in texture, with a mineral assemblage of plagioclase (Plg; 3–30%), clinopyroxene (Cpx; 2–5%), olivine (Ol; 1–4%) phenocrysts, and scarce orthopyroxene (Opx; <1%). Occasionally, glomeroporphyric clots contain subhedral to euhedral Plg, Cpx, and Ol. Plg phenocrysts (size between 0.05 and 2.0 mm) show sieved texture, polysynthetic twinning and rounded frames by crystal resorption (Supplementary Figure 1A). Cpx phenocrysts were anhedral to subhedral (rarely euhedral), with size between 0.1 and 1.7 mm and simple twinning (Supplementary Figure 1B), while Ol phenocrysts are anhedral to subhedral with size between 0.05 and 0.6 mm (Supplementary Figure 1C). The total amount of phenocrysts varies from 6 to 36%, however 1 to 29% of microlites are observed; thus, the whole-rock crystallinity (phenocrysts; microlites) varies from 7 to 65% (Figure 5C). The mixed avalanche pyroclasts are highly crystalline (65%), followed by the lava spatter (48%) and the scoria bombs (23%), while the lapilli fragments had lower crystallinities (7%) (Figure 5C). Vesicularity varies largely from 3 to 85%, with subangular to rounded (low to high sphericity) vesicles, which are elongated in some cases.
During the paroxysmal eruption of 3 March 2015, three airfall scoria textures were observed. The first had fluidal shape and smooth curviplanar surface with spherical vesicles <200 μm in size (Supplementary Figure 2A), the second was characterized by blocky morphology, with spherical to sub-spherical vesicles with size with size > 200 and < 500 μm (Supplementary Figure 2B), while the third had blocky morphology but elongated vesicles with fibrous walls with size up to 250 μm (Supplementary Figure 2C). These scorias had vesicularity of 70–90% by volume and crystal fraction was very low (<3%). Samples collected at the crater rim on 9 and 15 December 2015 showed blocky morphology but also extremely vesicular morphology (ca. 90%), with slightly low VND and narrow VSD (100–250 μm), respectively (Supplementary Figures 2D,E). However, the 13 February 2017 sample, also collected at the crater rim, had a texture similar to that observed in the second type of scoria ejected during the paroxysmal eruption (Supplementary Figure 2F). Geochemical compositions of juvenile particles range from 52.68 to 54.66 SiO2 wt.%, and are thus classified as basaltic andesite (Figure 5D; Supplementary Table 2) from the medium-K series (K2O from 0.40 to 0.62 wt. %). The samples that were erupted during 9 and 15 December 2015 and 13 February 2017 are more evolved when compared with the 3 March 2015 products.
Total Mass, Volume, and Eruption Source Parameters
The total mass (TM) of the deposit is estimated to 6.9 × 10⁸ kg using the exponential model (Figure 3B) with a single segment. Mass increases to 1.6 × 10⁹ kg, when two segments are integrated. A higher mass was obtained with the Weibull fit integration (Figure 3B), reaching 2.0 × 10⁹ kg. The correlation (R2-squared root) fit between these distributions and the field data varied from 0.989 to 0.997 for the single Exponential and the Weibull models respectively. The average TM derived from all methods was 1.4 × 10⁹ kg. Using an average deposit density of 567 kg/m3, obtained from the average density of 8 bulk proximal-to-distal tephra samples (Supplementary Table 3), we calculate bulk volumes between 1.2 and 3.4 × 10⁶ m3 and an average of 2.3 × 10⁶ m3, similarly to results of Bertin et al. (2015). The dense rock equivalent (DRE) of the total mass is 4.9 × 10⁵ m3 using an assumed basaltic melt density of 2850 kg/m3. TM is used to estimate the mass eruption rate (MER) using the eruption duration of the paroxysmal phase whose duration is estimated at 16 min. MER values from 7.6 × 10⁵ to 2.10 × 10⁶ kg/s were used for the TM spectrum retrieved by different integration methods (Table 1). An average MER of 1.48 × 10⁶ kg/s implies a column height of about 8.6 km according to the model of (Mastin et al., 2009) (Table 1). Application of the Carey and Sparks (1986) method for the estimation of the eruption column height using isopleths (Figure 3C) yields a column height of 10.8 km (Table 2). The magnitude and intensity of the eruption is inferred through MER values using the equations of Pyle (2015) resulting in magnitude and intensity values of 2.11 and 9.13 respectively (Table 1). Such characteristics are in agreement with a VEI 2-3 eruption in the classification scheme of Newhall and Self (1982).
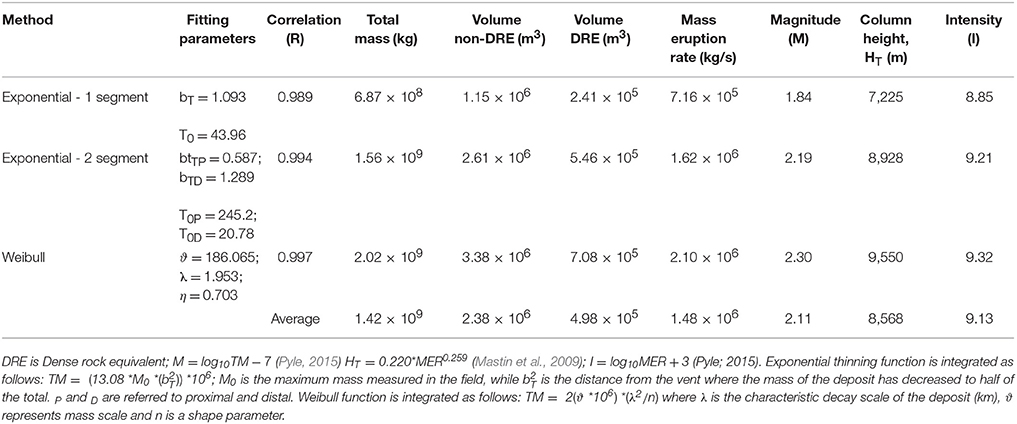
Table 1. Volume estimates and eruption source parameters of the 3 March 2015 lava fountain eruption from Villarrica volcano.
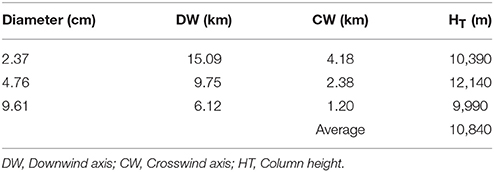
Table 2. Isopleth data obtained from field data interpolation, through the method of Carey and Sparks (1986).
Discussion and Conclusions
Data Reliability
Tephra mass/volume estimates are subject to different sources of uncertainty, such as tephra reworking, field data quality, contouring of isomass maps and integration models (e.g., Engwell et al., 2013; Biasse et al., 2014; Klawonn et al., 2014; Bonadonna et al., 2015). Although fieldwork for the present work was conducted more than 2 years after the eruption, the tephra fall deposit remained in a relatively unaltered state in most of the locations and no signs of erosion were apparent. Deposits consisted of uniform blankets of tephra without any sign of water dissection or aeolian sedimentary structures (Figure 4). The largest source of uncertainty comes from the border-conditions on the isomass map (0.1 kg/m2) in addition to bias in contouring due to limited field data. Uncertainty of contouring has been assessed for the integration of erupted volumes through isopach maps by Klawonn et al. (2014) but no reports are available for mass integration from isomass maps. However, both procedures are equivalent and uncertainties vary between 7 and 30% at well-sampled deposits (with field data at proximal, medial and distal areas) and for maps governed by extreme values (proximal and distal), respectively. Thus the maximum uncertainty in the mass estimation should be no larger than 30%. In addition, column heights estimated through the Carey and Sparks (1986) method are sensitive to the nature of the measured clasts, especially when these are susceptible to breakage during impact to the ground. To minimize this potential source of error, three largest particles were measured at each site. The best clast characterization has been reported to be the geometric mean of the three orthogonal axes with approximation of the minimum ellipsoid. However, discrepancies associated with the choice of number of particle axis are considered to be larger than the discrepancies associated with the number of clasts analyzed (Bonadonna et al., 2013). According to Biass and Bonadonna (2011) the average uncertainty is within 20% for all averaging techniques and contours considered. Nonetheless, the estimated values for column height are slightly larger (10.8 vs. 8.6 km; ~ 15% difference) using isopleths compared to MER or direct observation (SERNAGEOMIN, 2015). Estimates obtained through imagery analysis yield 11–12 km above the crater (Romero et al., 2016a), which is up to 10% larger than our estimates. However, this value should be considered as slightly overestimated due to the lack of side-views of the column, as all the pictures were taken from front view. In fact, the reported mean column height value of 10.8 km is between values estimated from imagery analyses and eyewitness estimates. Thus column-height uncertainty is about 10–15%. Uncertainty is also present in petrological and geochemical characterization. For instance, thin section description through polarizing microscope may have an uncertainty of 1–2% in the quantification of crystal and vesicle abundance and competence of the analyst.
Conduit Dynamics
The 3 March 2015 paroxysm products are characterized by a lower SiO2 content (~52.7 wt. %) than are lava lake products (~54.7 wt. %) (Figures 5D–F). The compositional trend observed at Villarrica (Figure 5E) was also observed during the 2,000 cyclic activity at Etna volcano, where Strombolian activity was found compositionally slightly more evolved than lava fountain scoria at Etna (Polacci et al., 2006). This means that the magma erupted during the 3 March 2015 paroxysmal event at Villarrica was less-differentiated (more primitive). Similar observations have been done by Aiuppa et al. (2009) during the transition from Strombolian to effusive activity at Stromboli volcano between February and April 2007. Furthermore, paroxysm products show a higher Al2O3/CaO ratio than that of lava lake (Figure 5F). This evidence confirms that the most explosive pyroclastic eruptions of Villarrica are characterized by a high Al2O3/CaO ratio (Hickey-Vargas et al., 1989, 2004; López-Escobar and Moreno, 1994). Our chemical data support the observation of Aiuppa et al. (2017), who conclude that the 3 March 2015 paroxysmal eruption of Villarrica was sourced by an intrusion of deep (20–35 MPa), primitive, volatile-rich magma. Such a trigger has been described previously as a typical mechanism for the generation of lava fountains and is known in the literature as the “foam collapse model” (Jaupart and Vergniolle, 1989), as opposed to the “rise-speed-dependent model” (Parfitt, 2004), which assumes that an eruption is triggered by syneruptive bubble exsolution accompanying magma rising in the conduit as the volume fraction of bubbles exceeds that of maximum packing.
The higher SiO2 content of lava lake products may be explained by convective conduit dynamics (Witter et al., 2004) during pre-eruptive (years to days) and post-paroxysmal (i.e., days and months after 3 March 2015 eruption) stages, where bubbly flow controls the bursting of lava lake and magma degassing (Figure 6A). The progressive increase of geophysical signals (i.e., increasing seismicity, thermal anomalies and rising of CO2/SO2 degassing) together with the rise of lava lake and Strombolian activity is interpreted as a higher participation of primitive magma within the conduit and a slug flow type volatile transport on 2 March 2015 (Figure 6B). A full involvement of primitive, low viscosity foamy basaltic-andesite magma during the 3 March 2015 eruption is believed to have produced both lava fountain and sustained tephra column during the paroxysmal eruption (Figure 6C).
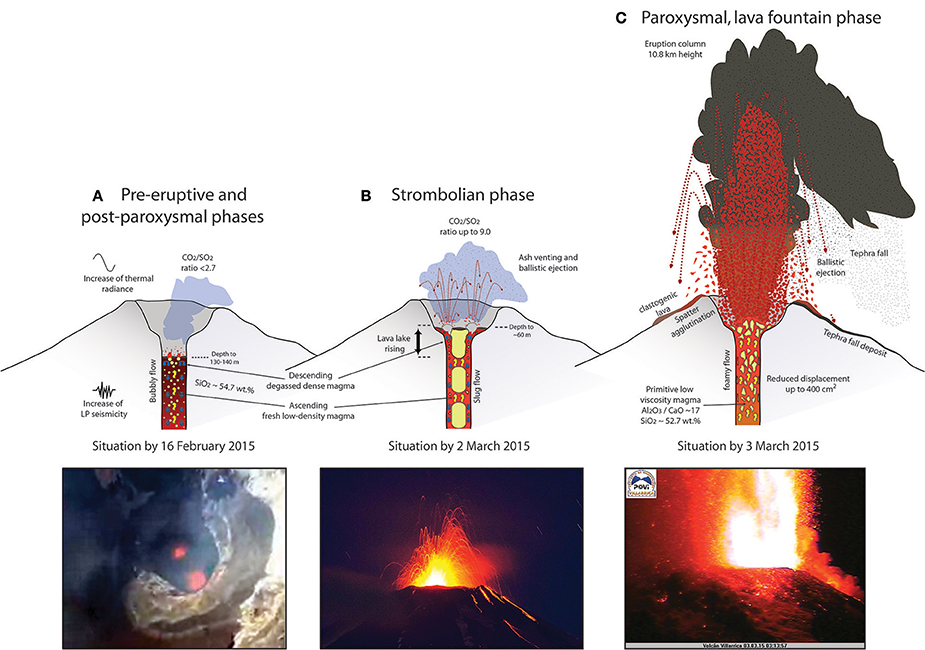
Figure 6. Cartoon (not-to-scale) illustrating conduit dynamics in the shallow plumbing system of Villarrica Volcano between 16 February and 3 March 2015. Panel (A) shows convective magma dynamics with lava lake at depth of 130–140 m below the crater rim (see Johnson et al., 2018). The rising of fresh (volatile-rich) low-density magma to the surface produces lava bursting at two small vents within the solidified crust of the lava lake. CO2/SO2 ratios are low (<2.6; Aiuppa et al., 2017) while simultaneously LP seismicity and thermal radiance start to rise. Aerial picture of the vent by Isa Stemberga. (B) An increased supply of deep-sourced volatile-rich magma produces a slug flow within the eruptive conduit, which results in the rise of lava lake (up to 60 m depth, Johnson et al., 2018), Strombolian activity and enriched CO2/SO2 degassing by 2 February (Aiuppa et al., 2017). (C) The rise of a more primitive basaltic-andesite foamy magma is associated with the beginning of lava fountaining activity and sustained eruption column. Ballistic pyroclasts, lava spatter, and tephra are discharged together during paroxysmal activity. Mixed avalanche deposits are not included within this model as they are currently object of research.
Tephras with unimodal grain-size distribution, which commonly are coarse-grained and better sorted than those for bimodal distributions are a typical feature of “dry” or “magmatic” explosivity (Houghton and Gonnermann, 2008). Tephras having bimodal grain-size distributions could be related to synsedimentary processes of sorting within the eruption column (e.g., Houghton et al., 2004). Particularly, sample at site14 which has a bimodal grain-size distribution, was collected fairly close to the north border of the deposit where surface crosswind may have played a role in grain-size selection. The eruption of different types of scoria can be explained by their textural features. For instance, blocky scoria containing two populations of sub-spherical bubbles, such as those seen during the paroxysmal eruption and then during the activity of 9 December 2015 and 13 February 2017, have previously been interpreted as coming from a waning discharge through ponded lava during increased outgassing (Parcheta et al., 2013; Figure 6A). The simultaneous eruption of scoria with spherical-shaped vesicles and scoria with stretched vesicles has been interpreted as the result of a violent eruptive phase triggered by the ascent of a fresher, crystal-poor, and highly vesicular magma (Di Traglia et al., 2009; Figure 6C). However, this does not rule out the possibility that stretched vesicles may result from shearing due to magma ascent close to the conduit margins (e.g., Polacci et al., 2001, 2003; Parcheta et al., 2013; Figure 6C). We interpret the bimodality of vesicle shapes as the simultaneous eruption of scoria coming from the margin and central part of the lava fountain during the paroxysmal event of 3 March 2015, and/or during the transition from Strombolian activity to a lava-fountain event as observed for other basaltic volcanoes (e.g., Wolff and Sumner, 2000; Taddeucci et al., 2015; Figures 6B,C).
Total vesicularity was higher in samples favored by a quick subaerial quenching process (i.e., scoria), suggesting a rapid loss of volatile content. Total crystallinity, on the other hand, was lower in these rocks. Glass content also slightly increased with vesicularity, but the overall glass content decreased as vesicles occupied a larger space in the whole sample. In addition, we observed a direct relation between the dispersal of erupted products and vesicularity, as more vesicular pyroclasts were deposited at greater distances from the vent due to their lower density. This relationship between vesicle-to-melt ratio, vesicle number density and vesicle size has been previously studied in lava fountains and it has been suggested that these textural properties are controlled by the length of residence time within the fountain (Stovall et al., 2011).
Lessons From the March 2015 Lava Fountain
Single paroxysmal events related to lava fountain activity generally last a few hours and erupt 108 to 109 kg of tephra (Taddeucci et al., 2015), which is well in agreement with the estimates presented here for the 3 March 2015 eruption. In fact, the triggering, initiation and size of the Villarrica lava fountain seems to be typical for this volcano and other analog volcanoes. Lava fountain height, eruption column height and MER values calculated here are comparable, for instance, to the eruptive parameters obtained for the largest-scale lava fountain events at Mt. Etna (e.g., 24 September 1986, 5 January 1990, 22 July 1998 and the climax MER of paroxysmal events between 2011 and 2015; see Andronico et al., 2015; Freret-Lorgeril et al., 2018 for details). In addition, the erupted volume is very similar to that from the Kilauea Iki Crater eruption (1959), which was the highest historical lava fountain event registered in Hawaii (height up to 580 m and erupted a total non-DRE volume between 2.1 and 5.8 × 10⁶ m3; Stovall et al., 2011; Klawonn et al., 2014) and slightly larger than the DRE tephra volume estimated for 2012–13 Tolbachik fissure eruptions (about 4.0 × 10⁵ m3; Belousov et al., 2015). In contrast, the violent Strombolian activity of Llaima volcano in 2008–2009 had lower intensity/MER values (~1.6 × 10⁴ kg/s) and lava-fountain-related column did not become sustained for the whole eruption duration, even though it produced equivalent peak thermal radiance values (89.5Wm−2sr−1μm−1 Wm−2sr−1μm−1; Romero et al., 2013) and a similar tephra fall volume (~1.31 × 10⁶ m3) and composition (basaltic andesite) (Ruth and Calder, 2014). This suggests that the 3 March eruption of Villarrica is an example of a high-intensity end member of lava fountain-related paroxysmal events. In addition, a rapid initiation of the paroxysmal eruption column following the lava fountain onset (~2 min) with an unexpected increase in volcanic hazard is here reported. This is a challenging aspect for volcanologists and civil protection authorities at active volcanoes having similar volcanic activity.
The historical record confirms that the volcanic phenomena observed during the 2015 Villarrica eruption are not isolated but frequent and constitute a major source of volcanic hazard (e.g., Van Daele et al., 2014). In this view, fresh knowledge acquired through the study of the 2015 eruption needs to be supplemented with historical accounts in order to improve measures for hazard mitigation during future eruptions. For example, probabilistic tephra fall hazard assessment and tephra fall accumulation maps, derived from historical events, would be helpful to forecast on the medium-to longer-term the impact of future tephra fall events at Villarrica.
Author Contributions
JR and FV undertook the fieldtrips and tephra sampling. JR, JB, AG, and EC analyzed tephra samples in laboratory. The paper was primarily written by JR. MP, DM, FA, MA, JP, MB, and JJ analyzed and discussed data and contributed to paper writing. However they are conducting complementary research to this work. WK provided samples from the crater rim after the main 2015 eruption, and also audiovisual registry from the eruption.
Funding
This study was partially supported by the NSFGEO-NERC grant Quantifying disequilibrium processes in basaltic volcanism (Reference: NE/N018575/1). Partial support for JJ was made possible through National Science Foundation EAR grant 0838562.
Conflict of Interest Statement
The authors declare that the research was conducted in the absence of any commercial or financial relationships that could be construed as a potential conflict of interest.
Acknowledgments
Authors would like to thank Robinson Garrido, Victoria Ramirez, and Nicolás Luengo for their assistance during field work. They are grateful to Diego Spatafore, Anselmo Durán, Martini Fotografía, José Rodríguez, Nicolás Gallo, Isa Stemberga, Patricio Arias, and Daniel Basualto (OVDAS) for the photos and to the staff of Sol y Luna, for accommodation at Pucón and transport to the volcano. Thin sections were prepared and studied at the Department of Geology of the Universidad de Atacama. SEM-EDS analyses were carried out at the DEMEX-EPN, Ecuador. Original data are available upon request. The fruitful and constructive reviews of two referees, in addition to the editorial handling of Dr. Sonia Calvari and Dr. Valerio Acocella, greatly improved the original version of this manuscript.
Supplementary Material
The Supplementary Material for this article can be found online at: https://www.frontiersin.org/articles/10.3389/feart.2018.00098/full#supplementary-material
Supplementary Figure 1. Thin sections of juvenile products erupted by 3 March 2015 seen at cross polarized light (left) and plane polarized light (right). (A) corresponds to the scoria bomb, (B) to the scoria lapilli and (C) to the mixed avalanche juvenile fragment.
Supplementary Figure 2. Scanning electron microscope (SEM) images. Yellow scale bars are 500 μm in length. (A–C) are three different basaltic-andesitic scoria (tachylite) morphologies erupted by 3 March 2015 (A—smooth curviplanar surface, B—blocky morphology with spherical vesicles and C—blocky morphology with elongated vesicles plus fibrous walls). (D–F) are blocky tachylite erupted by 9 December 2015, 15 December 2015 and 13 February 2017, respectively.
Supplementary Table 1. Field data with the location of sample points, tephra loads, and maximum scoria size measured. D means distance from the vent.
Supplementary Table 2. SEM-EDS semi-quantitative geochemical glass composition of samples from Villarrica volcano. The X-Ray intensities directly obtained on glass were converted to wt. % of oxides. Notice that MnO and P2O5 are not recognized within this method. Total values are uncorrected.
Supplementary Table 3. Apparent density calculations on 7 bulk tephra deposit samples collected at the field locations labeled (see Supplementary Table 1). Average density is representative of the whole deposit as samples were collected at proximal, medial and distal locations. The samples 13A and 13B were collected at a distance of 10 m of difference for comparison control purpose.
References
Aiuppa, A., Bitetto, M., Francofonte, V., Velasquez, G., Bucarey-Parra, C., Giudice, G., et al. (2017). A CO2-gas precursor to the March 2015 Villarrica volcano eruption. Geochem. Geophys. Geosys. 18, 2120–2132. doi: 10.1002/2017GC006892
Aiuppa, A., Federico, C., Giudice, G., Giuffrida, G., Guida, R., Gurrieri, S., et al. (2009). The 2007 eruption of Stromboli volcano: insights from real-time measurement of the volcanic gas plume CO2/SO2 ratio. J. Volcanol. Geothermal Res. 182, 221–230. doi: 10.1016/j.jvolgeores.2008.09.013
Allard, P., Burton, M., and Muré, F. (2005). Spectroscopic evidence for a lava fountain driven by previously accumulated magmatic gas. Nature 433, 407–410. doi: 10.1038/nature03246
Andronico, D., and Corsaro, R. A. (2011). Lava fountains during the episodic eruption of South–East Crater (Mt. Etna), 2000: insights into magma-gas dynamics within the shallow volcano plumbing system. Bull. Volcanol. 73, 1165–1178. doi: 10.1007/s00445-011-0467-y
Andronico, D., Cristaldi, A., and Scollo, S. (2008). The 4–5 September 2007 lava fountain at South-East Crater of Mt Etna, Italy. J. Volcanol. Geotherm. Res. 173, 325–328. doi: 10.1016/j.jvolgeores.2008.02.004
Andronico, D., Scollo, S., Castro, M. D. L., Cristaldi, A., Lodato, L., and Taddeucci, J. (2014a). Eruption dynamics and tephra dispersal from the 24 November 2006 paroxysm at South-East Crater, Mt Etna, Italy. J. Volcanol. Geotherm. Res. 274, 78–91. doi: 10.1016/j.jvolgeores.2014.01.009
Andronico, D., Scollo, S., and Cristaldi, A. (2015). Unexpected hazards from tephra fallouts at Mt Etna: The 23 November 2013 lava fountain. J. Volcanol. Geotherm. Res. 304, 118–125. doi: 10.1016/j.jvolgeores.2015.08.007
Andronico, D., Scollo, S., Cristaldi, A., and Castro, M. D. L. (2014b). Representivity of incompletely sampled fall deposits in estimating eruption source parameters: a test using the 12–13 January 2011 lava fountain deposit from Mt. Etna volcano, Italy. Bull. Volcanol. 76:861.doi: 10.1007/s00445-014-0861-3
Belousov, A., Belousova, M., Edwards, B., Volynets, A., and Melnikov, D. (2015). Overview of the precursors and dynamics of the 2012–13 basaltic fissure eruption of Tolbachik Volcano, Kamchatka, Russia. J. Volcanol. Geotherm. Res. 307, 22–37.doi: 10.1016/j.jvolgeores.2015.06.013
Bertin, D., Amigo, A., and Bertin, L. (2015). Erupción del volcán Villarrica 2015: Productos emitidos y volumen involucrado. XIV Congreso Geológico Chileno (La Serena).
Biass, S., and Bonadonna, C. (2011). A quantitative uncertainty assessment of eruptive parameters derived from tephra deposits: the example of two large eruptions of Cotopaxi volcano, Ecuador. Bull. Volcanol. 73, 73–90. doi: 10.1007/s00445-010-0404-5
Biasse, S., Bagheri, G., Aeberhard, W., and Bonadonna, C. (2014). TError: towards a better quantification of the uncertainty propagated during the characterization of tephra deposits. Stat. Volcanol. 1, 1–27. doi: 10.5038/2163-338X.1.2
Bonaccorso, A., Caltabiano, T., Currenti, G., Del Negro, C., Gambino, S., Ganci, G., et al. (2011). Dynamics of a lava fountain revealed by geophysical, geochemical and thermal satellite measurements: The case of the 10 April 2011 Mt Etna eruption. Geophys. Res. Lett. 38. doi: 10.1029/2011GL049637
Bonaccorso, A., Calvari, S., Linde, A., and Sacks, S. (2014). Eruptive processes leading to the most explosive lava fountain at Etna volcano: the 23 November 2013 episode. Geophys. Res. Lett. 41, 4912–4919. doi: 10.1002/2014GL060623
Bonadonna, C., Biass, S., and Costa, A. (2015). Physical characterization of explosive volcanic eruptions based on tephra deposits: propagation of uncertainties and sensitivity analysis. J. Volcanol. Geotherm. Res. 296, 80–100. doi: 10.1016/j.jvolgeores.2015.03.009
Bonadonna, C., Cioni, R., Pistolesi, M., Connor, C. B., Scollo, S., Pioli, L., et al. (2013). Determination of the largest clast sizes of tephra deposits for the characterization of explosive eruptions: a study of the IAVCEI commission on tephra hazard modelling. Bull. Volcanol. 75:680. doi: 10.1007/s00445-012-0680-3
Bonadonna, C., and Costa, A. (2012). Estimating the volume of tephra deposits: a new simple strategy. Geology 40, 415–418. doi: 10.1130/G32769.1
Calder, E., Harris, A., Peña, P., Pilger, E., Flynn, L., Fuentealba, G., et al. (2004). Combined thermal and seismic analysis of the Villarrica volcano lava lake, Chile. Rev. Geol. 31, 259–272. doi: 10.4067/S0716-02082004000200005
Carey, S., and Sparks, R. S. J. (1986). Quantitative models of the fallout and dispersal of tephra from volcanic eruption columns. Bull. Volcanol. 48, 109–125. doi: 10.1007/BF01046546
Carracedo, M., Sarrionandia, F., Arostegui, J., Eguiluz, L., and Ibarguchi, J. G. (2012). The transition of spatter to lava-like body in lava fountain deposits: features and examples from the Cabezo Segura volcano (Calatrava, Spain). J. Volcanol. Geotherm. Res. 227–228, 1–14. doi: 10.1016/j.jvolgeores.2012.02.016
Clarin (2015). Un volcán Reavivó el Fantasma de las cenizas en la Patagonia. Clarin.com – Sociedad. Available online at: https://www.clarin.com/sociedad/volcan-villarrica-cenizas-patagonia_0_rk-j_XqDQg.html (Accessed March 17, 2018).
Córdova, L., Alarcón, A., Mardones, C., Cardona, C., Gil, F., Rojas, G., et al. (2015). “Monitoreo de la Deformación en Volcanes Chilenos Mediante Técnica GPS, Resultados Asociados a la Actividad de Los Volcanes Laguna del Maule, Copahue y Villarrica,” in XIV Congreso Geológico Chileno (La Serena: Colegio de Geólogos de Chile).
Corsaro, R. A., and Miraglia, L. (2014). The transition from summit to flank activity at Mt. Etna, Sicily (Italy): Inferences from the petrology of products erupted in 2007–2009. J. Volcanol. Geothermal Res. 275, 51–60. doi: 10.1016/j.jvolgeores.2014.02.009
Delgado, F., Pritchard, M. E., Ebmeier, S., González, P., and Lara, L. (2017). Recent unrest (2002–2015) imaged by space geodesy at the highest risk Chilean volcanoes: villarrica, Llaima, and Calbuco (Southern Andes). J. Volcanol. Geotherm. Res. 344, 270–288. doi: 10.1016/j.jvolgeores.2017.05.020
Di Traglia, F., Cimarelli, C., De Rita, D., and Torrente, D. G. (2009). Changing eruptive styles in basaltic explosive volcanism: examples from Croscat complex scoria cone, Garrotxa Volcanic Field (NE Iberian Peninsula). J. Volcanol. Geothermal Res. 180, 89–109. doi: 10.1016/j.jvolgeores.2008.10.020
Engwell, S. L., Sparks, R. S. J., and Aspinall, W. P. (2013). Quantifying uncertainties in the measurement of tephra fall thickness. J. Appl.Volcanol. 2:5. doi: 10.1186/2191-5040-2-5
Flores, F., and Amigo, A. (2015). “Dinámica de Flujos Laháricos Asociados a la Erupción del 3 de Marzo del Volcán Villarrica,” in XIV Congreso Geológico Chileno (La Serena: Colegio de Geólogos).
Freret-Lorgeril, V., Donnadieu, F., Scollo, S., Provost, A., Fréville, P., Guéhenneux, Y., et al. (2018). Mass Eruption Rates of tephra plumes during the 2011-2015 lava fountain paroxysms at Mt. Etna from Doppler radar retrievals. Front. Earth Sci. 6:73. doi: 10.3389/feart.2018.00073
Giacomozzi, R. M., Parra, C. B., Herrera, C. E., Valencia, G. G., and Lara, L. (2015). “Flujos de Dióxido de Azufre (SO2) del Volcán Villarrica, Periodo 2012–2015,” in XIV Congreso Geológico Chileno (La Serena: Colegio de Geólogos).
Gurioli, L., Harris, A. J., Houghton, B. F., Polacci, M., and Ripepe, M. (2008). Textural and geophysical characterization of explosive basaltic activity at Villarrica volcano. J. Volcanol. Geotherm. Res. 113:B08206. doi: 10.1029/2007JB005328
Hickey-Vargas, R., López-Escobar, L., Moreno, H., Clavero, J., Lara, L., and Sun, M. (2004). Magmatic evolution of the villarrica volcano,” in Villarrica Volcano (39.5°S), eds L. E. Lara, and J. Clavero (Santiago: Servicio Nacional de Geología y Minería), 39–45.
Hickey-Vargas, R., Moreno, H., López-Escobar, L., and Frey, F. (1989). Geochemical variations in Andean basaltic and silicic lavas from the Villarrica-Lanín volcanic chain (39.5 °S): an evaluation of source heterogeneity, fractional crystallization and crustal assimilation. Contribut. Mineral. Petrol. 103, 361–386. doi: 10.1007/BF00402922
Houghton, B. F., and Gonnermann, H. M. (2008). Basaltic explosive volcanism: constraints from deposits and models. Chem. Erde Geochem. 68, 117–140. doi: 10.1016/j.chemer.2008.04.002
Houghton, B. F., Wilson, C. J. N., Fierstein, J., and Hildreth, W. (2004). Complex proximal deposition during the Plinian eruptions of 1912 at Novarupta, Alaska. Bull. Volcanol. 66, 95–133. doi: 10.1007/s00445-003-0297-7
Inostroza, M., Aguilera, F., González, C., Layana, S., and Chocobar, J. (2015). “Variaciones en la anomalía termal del volcán Villarrica asociados al pulso eruptivo de Marzo 2015: Interpretaciones mediante imágenes Landsat ETM+y OLI,” in XIV Congreso Geológico Chileno (La Serena).
Jaupart, C., and Vergniolle, S. (1989). The generation and collapse of foam layer at the roof of a basaltic magma chamber. J. Fluid Mech. 203, 347–380, doi: 10.1017/S0022112089001497
Johnson, J. B., Watson, L. M., Palma, J. L., Dunham, E. M., and Anderson, J. F. (2018). Forecasting the eruption of an open-vent volcano using resonant infrasound tones. Geophys. Res. Lett. 45, 2213–2220. doi: 10.1002/2017GL076506
Johnson, J., and Palma, J. L. (2015). Lahar infrasound associated with Volcán Villarrica's 3 March 2015 eruption. Geophys. Res. Lett. 42, 6324–6331. doi: 10.1002/2015GL065024
Klawonn, M., Houghton, B. F., Swanson, D. A., Fagents, S. A., Wessel, P., and Wolfe, C. J. (2014). From field data to volumes: constraining uncertainties in pyroclastic eruption parameters. Bull. Volcanol. 76:839. doi: 10.1007/s00445-014-0839-1
Lohmar, S., Parada, M. A., Gutiérrez, F., Robin, C., and Gerbe, M. C. (2012). Mineralogical and numerical approaches to establish the pre-eruptive conditions of the mafic Licán Ignimbrite, Villarrica Volcano (Chilean Southern Andes). J. Volcanol. Geotherm. Res. 235–236, 55–69. doi: 10.1016/j.jvolgeores.2012.05.006
López-Escobar, L., and Moreno, H. (1994). Contribution to the Knowledge of the Postglacial Geochemical Evolution of the Villarrica volcano. Southern Andes, 39°25'S. VII Congreso Geológico Chileno (Concepción, October 1994), Universidad de Concepción, 1091–1094.
Mastin, L. G., Guffanti, M., Servranckx, R., Webley, P., Barsotti, S., Dean, K., et al. (2009). A multidisciplinary effort to assign realistic source parameters to models of volcanic ash-cloud transport and dispersion during eruptions. J. Volcanol. Geotherm. Res. 186, 10–21. doi: 10.1016/j.jvolgeores.2009.01.008
Moreno, H., and Clavero, J. (2006). Geología del Volcán Villarrica, Regiones de la Araucanía y de Los Lagos. Carta Geológica de Chile, Serie Geología Básica No. 98, Santiago: Servicio Nacional de Geología y Minería.
Morgado, E., Parada, M. A., Contreras, C., Castruccio, A., Gutiérrez, F., and McGee, L. E. (2015). Contrasting records from mantle to surface of Holocene lavas of two nearby arc volcanic complexes: Caburgua-Huelemolle Small Eruptive Centers and Villarrica Volcano, Southern Chile. J. Volcanol. Geotherm. Res. 306, 1–16. doi: 10.1016/j.jvolgeores.2015.09.023
Naranjo, J. A., and Moreno, H. (2004). “Laharic debris – flows form Villarrica Volcano,” in Villarrica Volcano (39.5°S), Southern Andes, eds L. E. Lara and J. Clavero (Chile: Boletín Servicio Nacional de Geología y Minería), 28–38.
Newhall, C., and Self, S. (1982). The volcanic explosivity index (VEI): An estimate of explosive magnitude for historical volcanism. J. Geophys. Res. 87, 1231–1238. doi: 10.1029/JC087iC02p01231
Palma, J. L., Calder, E. S., Basualto, D., Blake, S., and Rothery, D. A. (2008). Correlations between SO2 flux, seismicity, and outgassing activity at the open vent of Villarrica volcano, Chile. J. Geophys. Res. Solid Earth 113:B10201. doi: 10.1029/2008JB005577
Parcheta, C. E., Houghton, B. F., and Swanson, D. A. (2013). Contrasting patterns of vesiculation in low, intermediate, and high Hawaiian fountains: a case study of the 1969 Mauna Ulu eruption. J. Volcanol. Geotherm. Res. 255, 79–89. doi: 10.1016/j.jvolgeores.2013.01.016
Parfitt, E. A. (2004), A discussion of the mechanisms of explosive basaltic eruptions. J. Volcanol. Geotherm. Res. 134, 77–107. doi: 10.1016/j.jvolgeores.2004.01.002
Petit-Breuilh, M. E., and Lobato, J. (1994). Análisis Comparativo de la Cronología Eruptiva Histórica de los volcanes Llaima y Villarrica (38–39°S). VII Congreso Geológico Chileno (Concepción, October 1994), Universidad de Concepción, 366–370.
Polacci, M., Corsaro, R. A., and Andronico, D. (2006). Coupled textural and compositional characterization of basaltic scoria: insights into the transition from Strombolian to fire fountain activity at Mount Etna, Italy. Geology 34, 201–204. doi: 10.1130/G22318.1
Polacci, M., Papale, P., and Rosi, M. (2001). Textural heterogeneities in pumices from the climactic eruption of Mount Pinatubo, 15 June 1991, and implication for magma ascent dynamics. Bull. Volcanol. 63, 83–97. doi: 10.1007/s004450000123
Polacci, M., Pioli, L., and Rosi, M. (2003). The Plinian phase of the Campanian Ignimbrite eruption (Phlegrean Fields, Italy): evidence from density measurements and textural characterization of pumice. Bull. Volcanol. 65, 418–432. doi: 10.1007/s00445-002-0268-4
Pyle, D. M. (1989). The thickness, volume and grainsize of tephra fall deposits. Bull. Volcanol. 51, 1–15. doi: 10.1007/BF01086757
Pyle, D. M. (2015). “Sizes of volcanic eruptions,” in The Encyclopedia of Volcanoes, 2nd Edn, eds. H. Sigurdsson, B. Houghton, S. McNutt, H. Rymer, and J. Stix (London: Encyclopedia of Volcanoes, Academic Press), 263–269.
Romero, J. E., Keller, W., and Marfull, V. (2013). Short chronological analysis of the 2007-2009 eruptive cycle and its nested cones formation at Llaima volcano. J. Technol. Possibilism 2, 1–9. Available online at: http://www.revistas.usach.cl/ojs/index.php/jotp/article/download/1395/1301
Romero, J., Keller, W., Díaz-Alvarado, J., Polacci, M., and Inostroza, F. (2016a). The 3 March 2015 Eruption of Villarrica Volcano, Southern Andes of Chile: Overview of deposits and impacts. Encuentro del Centro Internacional de Ciencias de la Tierra (E-ICES 11). International Center for Earth Science (ICES), Comisión Nacional de Energía Atómica (CNEA), Facultad de Exactas y Naturales, Facultad de Ciencias Políticas y Sociales, Universidad Nacional de Cuyo, Mendoza, Argentina.
Romero, J. E., Morgavi, D., Arzilli, F., Daga, R., Caselli, A., Reckziegel, F., et al. (2016b). Eruption dynamics of the 22–23 April 2015 Calbuco Volcano (Southern Chile): Analyses of tephra fall deposits. J. Volcanol. Geotherm. Res. 317, 15–29. doi: 10.1016/j.jvolgeores.2016.02.027
Rose, W. I., Palma, J. L., Delgado Granados, H., and Varley, N. (2013). “Open-vent volcanism and related hazards: overview,” in Understanding Open-Vent Volcanism and Related Hazards: Geological Society of America Special Paper, eds W. I. Rose, J. L. Palma, H. Delgado Granados, and N. Varley, vii–xiii.
Ruth, D. C., and Calder, E. S. (2014). Plate tephra: preserved bubble walls from large slug bursts during violent Strombolian eruptions. Geology 42, 11–14. doi: 10.1130/G34859.1
Ruth, D. C., Cottrell, E., Cortés, J. A., Kelley, K. A., and Calder, E. S. (2016). From passive degassing to violent strombolian eruption: the case of the 2008 eruption of Llaima volcano, Chile. J. Petrol. 57, 1833–1864. doi: 10.1093/petrology/egw063
SERNAGEOMIN (2015). Informe de Resumen Crisis Volcán Villarrica, Febrero-Marzo 2015. Red Nacional de Vigilancia Volcánica, OVDAS, Servicio Nacional de Geología y Minería (Santiago), 17.
Stovall, W. K., Houghton, B. F., Gonnermann, H., Fagents, S. A., and Swanson, D. A. (2011). Eruption dynamics of Hawaiian-style fountains: the case study of episode 1 of the Kilauea Iki 1959 eruption. Bull. Volcanol. 73, 511–529.
Taddeucci, J., Edmonds, M., Houghton, B., James, M. R., and Vergniolle, S. (2015). “Hawaiian and Strombolian eruptions,” in Encyclopedia of Volcanoes, eds H. Sigurdsson, B. F. Houghton, S. R. McNutt, H. Rymer, J. Stix (London: Academic Press) 485–503.
Van Daele, M., Moernaut, J., Silversmit, G., Schmidt, S., Fontijn, K., Heirman, K., et al. (2014). The 600 yr eruptive history of Villarrica Volcano (Chile) revealed by annually laminated lake sediments. GSA Bull. 126:481. doi: 10.1130/B30798.1
Vera, F., and Palma, J. L. (2017). “Avalanchas mixtas y depósitos proximales generados en la erupción de 2015 del Volcán Villarrica y su interacción con la cubierta glacial,” in VIII Encuentro Nacional de Estudiantes de Geología (Copiapó: Universidad de Atacama).
Witter, J., Kress, V., Delmelle, P., and Stix, J. (2004). Volatile degassing, petrology, and magma dynamics of the Villarrica lava lake, Southern Chile. J. Volcanol. Geotherm. Res. 134, 303–337. doi: 10.1016/j.jvolgeores.2004.03.002
Keywords: lava fountain, tephra fall, eruption parameters, Villarrica Volcano, Southern Andes
Citation: Romero JE, Vera F, Polacci M, Morgavi D, Arzilli F, Alam MA, Bustillos JE, Guevara A, Johnson JB, Palma JL, Burton M, Cuenca E and Keller W (2018) Tephra From the 3 March 2015 Sustained Column Related to Explosive Lava Fountain Activity at Volcán Villarrica (Chile). Front. Earth Sci. 6:98. doi: 10.3389/feart.2018.00098
Received: 14 April 2018; Accepted: 29 June 2018;
Published: 24 July 2018.
Edited by:
Sonia Calvari, Istituto Nazionale di Geofisica e Vulcanologia (INGV), ItalyReviewed by:
Victoria C. Smith, University of Oxford, United KingdomJon J. Major, United States Geological Survey, United States
Copyright © 2018 Romero, Vera, Polacci, Morgavi, Arzilli, Alam, Bustillos, Guevara, Johnson, Palma, Burton, Cuenca and Keller. This is an open-access article distributed under the terms of the Creative Commons Attribution License (CC BY). The use, distribution or reproduction in other forums is permitted, provided the original author(s) and the copyright owner(s) are credited and that the original publication in this journal is cited, in accordance with accepted academic practice. No use, distribution or reproduction is permitted which does not comply with these terms.
*Correspondence: Jorge E. Romero, jorge_eduardorm@gotmail.com